| AutoFEM Analysis Applying Custom Graphs | |||||||
| AutoFEM Analysis Applying Custom Graphs | |||||||
The system provides the possibility to use variable values of physical entities in calculations. Depending on the study type, the user can define a dependence of a boundary condition on the time or temperature.
Time curves can be used in the boundary conditions of the following study types:
•Dynamic Analysis (Direct Integration)
•Dynamic Analysis - Mode Superposition
•Dynamic Analysis - Frequency & Mode Superposition
•Thermal Analysis - Transient Process
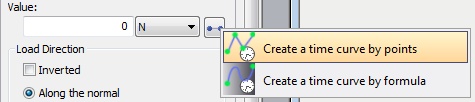
Retrieving the time curve creation command
Thermal curves can be used in the boundary conditions of the following study types:
•Thermal Analysis - Steady State
•Thermal Analysis - Transient Process
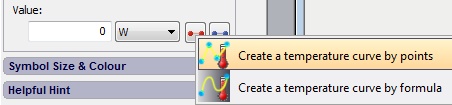
Retrieving the temperature curve creation command
Also thermal curves are used for defining temperature dependences of material properties (see Temperature Curves) in the AutoFEM Material Library. In all cases the same Graphics Editor is used.
If the study type allows to use graphics, as mentioned above, a special pictogram becomes available in the boundary condition dialogue ![]() . Contextual menu on the pictogram allows to create one of two possible variants of time or temperature curves:
. Contextual menu on the pictogram allows to create one of two possible variants of time or temperature curves:
If a value in the boundary condition dialogue is defined by a curve, the pictogram looks as ![]() . The user can Edit / Remove the assigned curve via the contextual menu clicking on the pictogram
. The user can Edit / Remove the assigned curve via the contextual menu clicking on the pictogram ![]() .
.
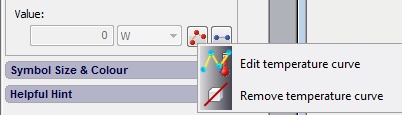
Retrieving the commands "Edit / Remove curve" .
See also: Applying Custom Graphs, Graph, Based on Point Set, Graph, Based on Formula, Auxiliary Commands of Graph Editor