| AutoFEM Analysis Graph, Based on Point Set | |||||||
| AutoFEM Analysis Graph, Based on Point Set | |||||||
Empiric data can form a graph by a "Point Set". Such graphs are frequently used in defining "Temperature curves" of materials or may be, for example, seismic or other measured data obtained from any natural phenomenon.
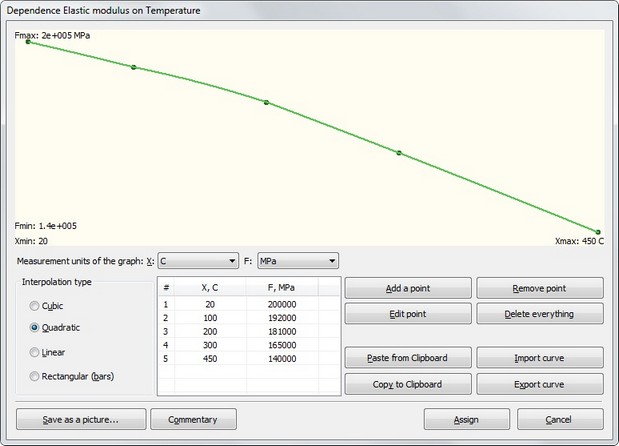
Temperature curve of material property defined by points
To define a graph by points, the user should use the following sequence of actions
1.Select the desirable measurement units for axes X and Y ( they can be changed later, but you should pay attention on the units during the graph creation).
![]()
Set right units
2.Press the button ![]() . In the opened dialogue box, enter values for the first point, press OK.
. In the opened dialogue box, enter values for the first point, press OK.
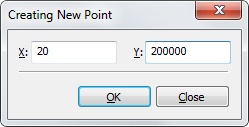
Define the first point value
3.Press the button "Add a point" again. In the opened dialogue box, enter values for the second point, press OK.
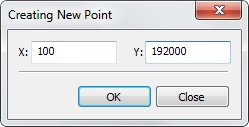
Define the next point value
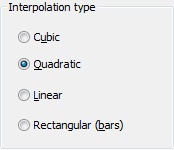
4. Use the desirable interpolation type to get the required quality of the graph.
4. After filling the last point, press the button ![]() , to finish editing and complete defining the curve.
, to finish editing and complete defining the curve.
Use the buttons ![]() ,
, ![]() to edit / remove the point, selected in the point table.
to edit / remove the point, selected in the point table.
![]() removes all graphical data (points).
removes all graphical data (points).
See also: Applying Custom Graphs, Graph, Based on Point Set, Graph, Based on Formula, Auxiliary Commands of Graph Editor